Help
1: Dynamic Expression Module
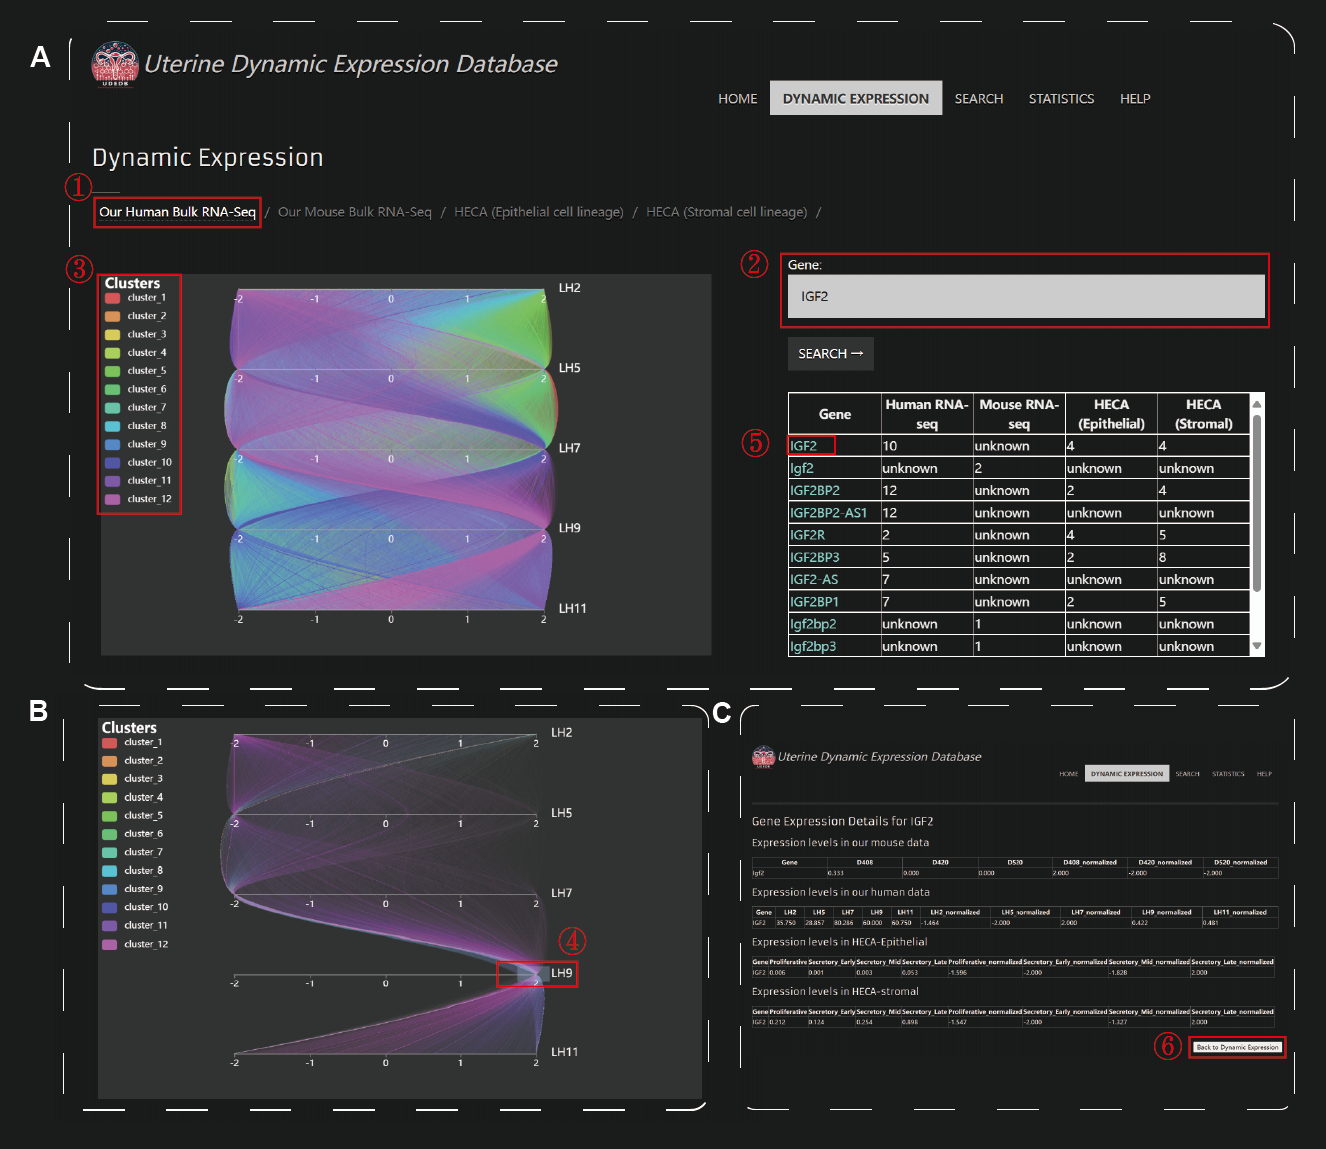
Upon accessing the Dynamic Expression module, users are presented with a selection of four distinct datasets: our human bulk RNA-seq data, our mouse RNA-seq data, scRNA-seq data from the functional layer of the endometrium sourced from HECA, and scRNA-seq data from the stromal layer of the endometrium sourced from HECA. To investigate gene expression dynamics, users can search for individual genes of interest using the search functionality located on the right-hand side of the interface. Upon entering a gene name, the website provides detailed information about the gene's expression profile across the selected datasets, including its cluster assignment. Clustering is based on the similarity of expression patterns over time, allowing users to identify genes that exhibit coordinated regulatory behavior. For a broader perspective, users can select a specific cluster to view the collective dynamic expression patterns of all genes within that cluster. The dynamic expression plots are fully interactive, enabling users to zoom in on specific time points and expression ranges to explore patterns in greater detail. In addition to cluster-level analysis, UDEDB supports gene-specific investigations. By selecting a gene from the search results, users can access detailed expression quantification data, including raw and normalized expression values across all selected datasets.
2: Search Module
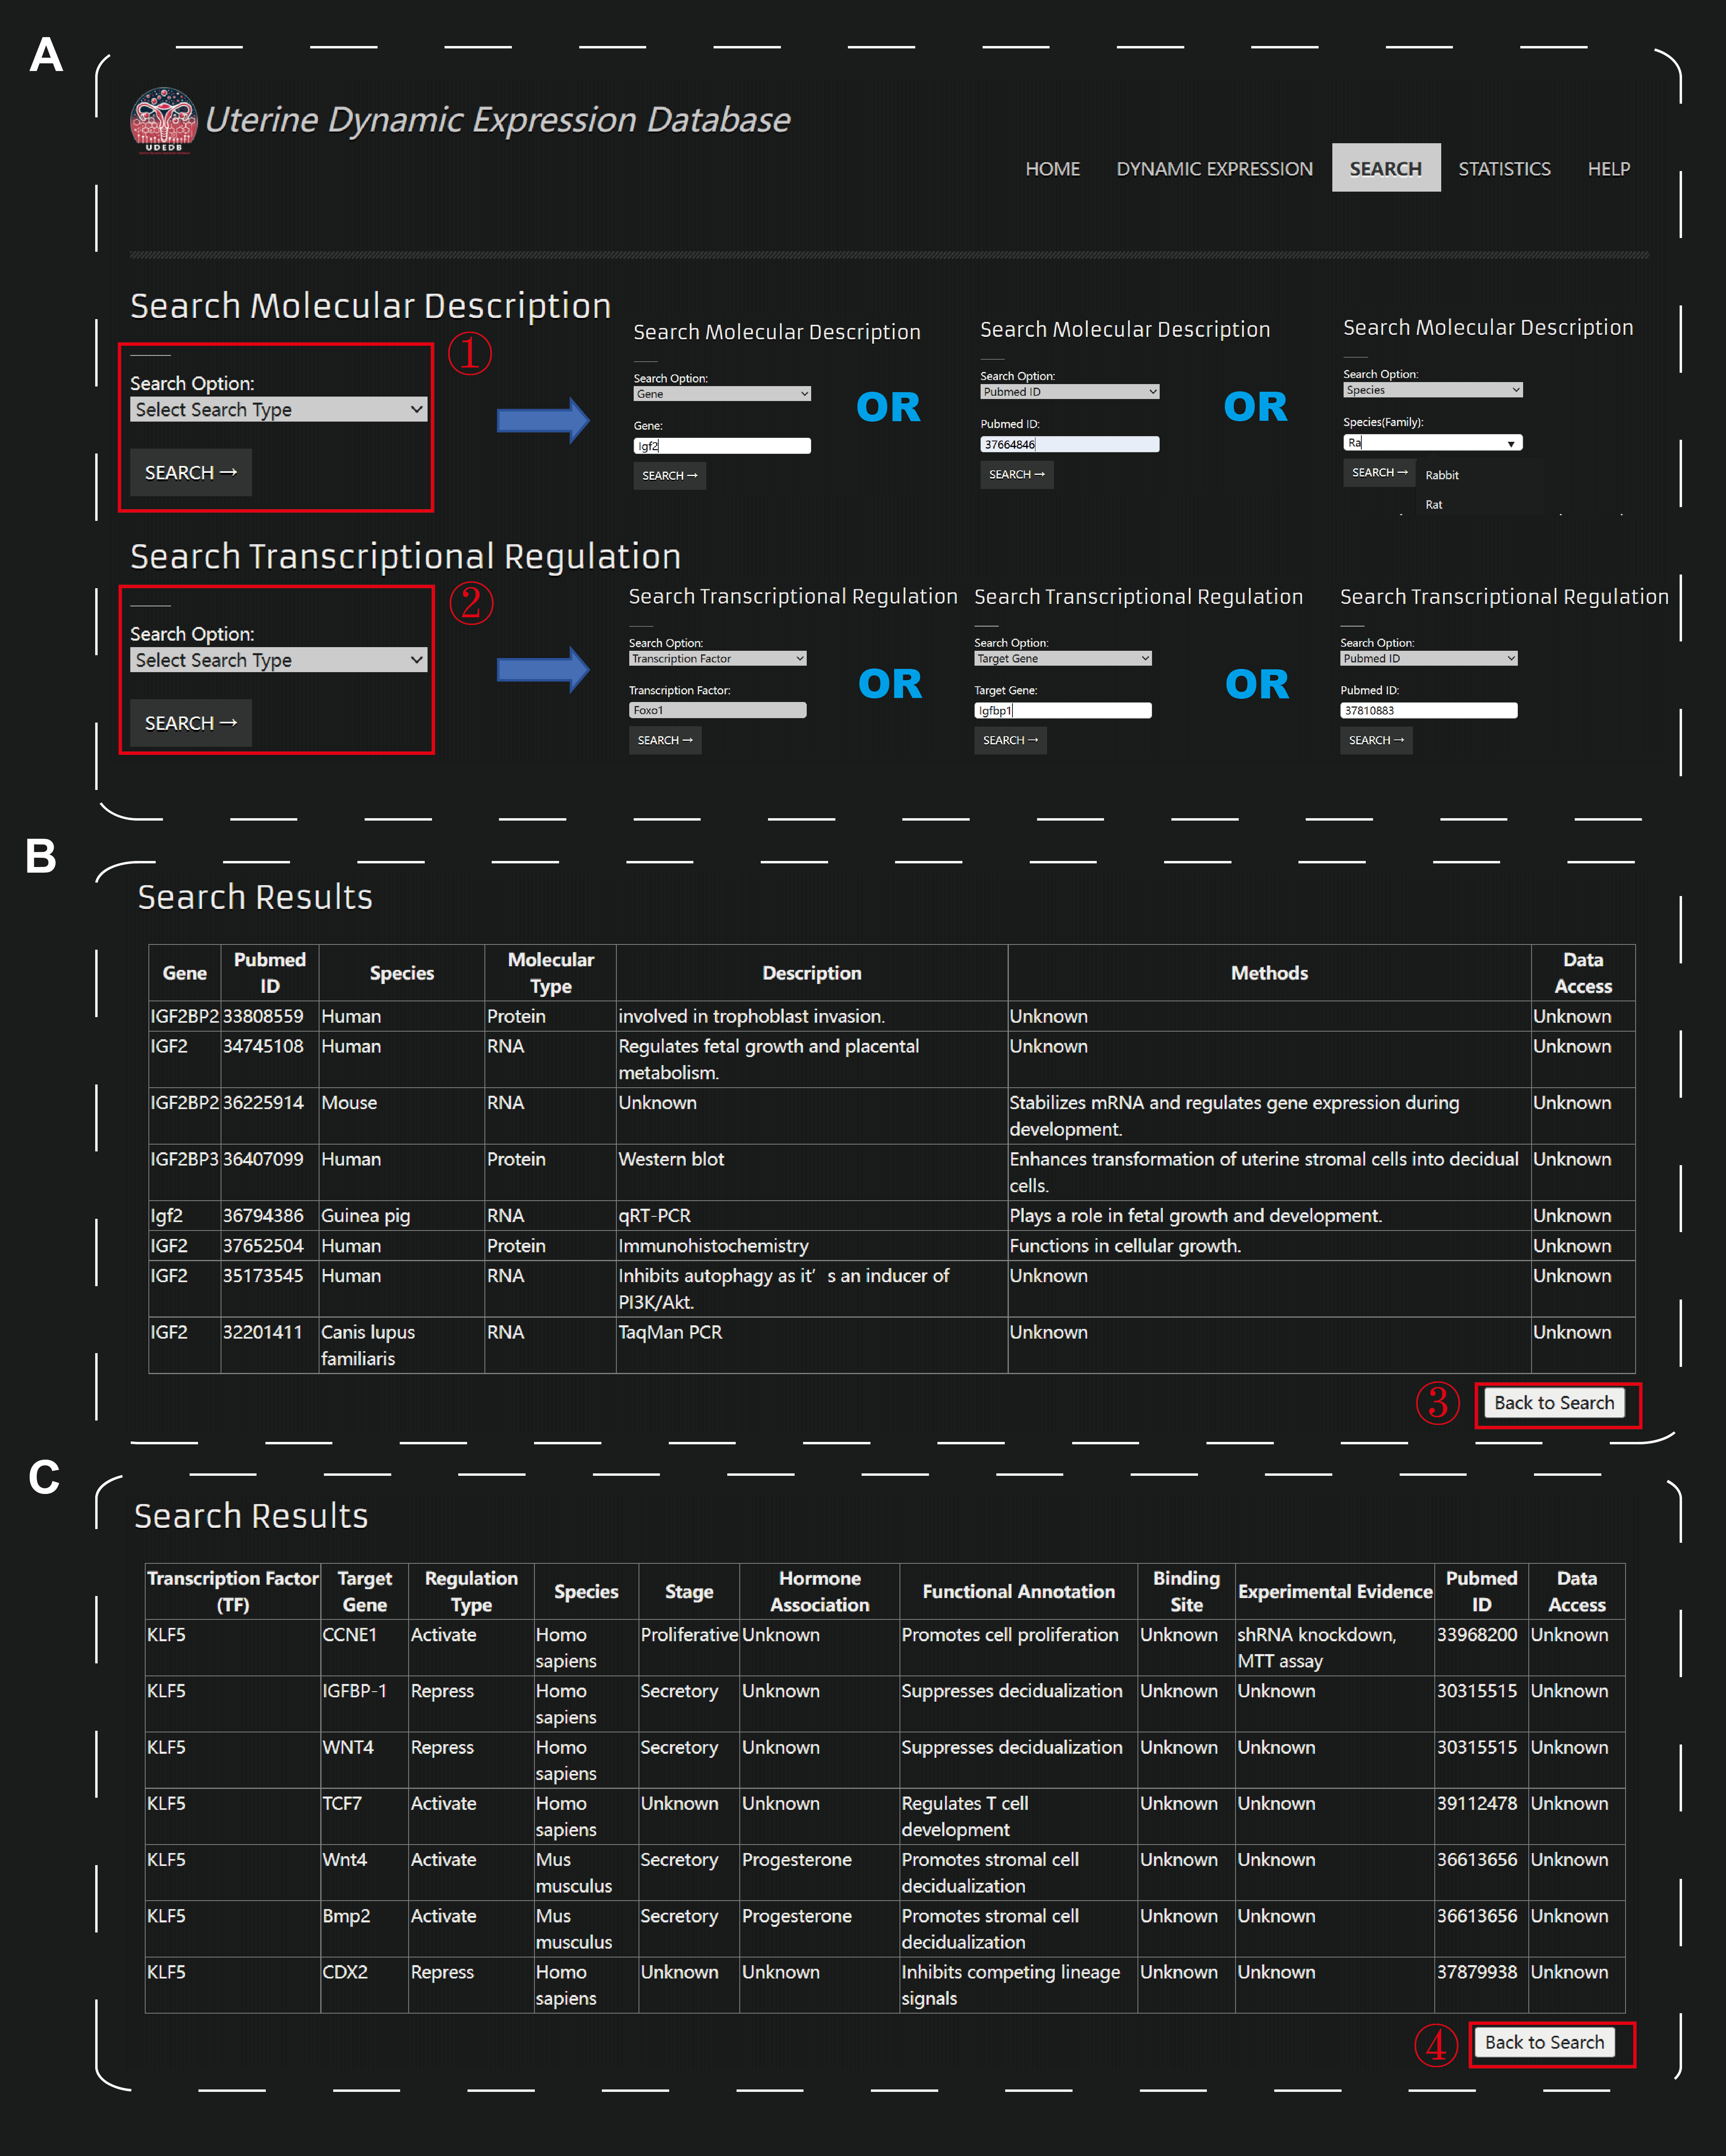
The other major functionality of UDEDB is the Search module. This module allows users to retrieve molecular descriptions or transcriptional regulation information obtained through text mining. For molecular descriptions, users can initiate a query by selecting the desired search type from three available options: Gene, PubMed ID, or Species (Figure A). After choosing a query type, users enter the relevant keyword into the search box, which features an auto-suggestion function to assist with accurate input. Once the query is submitted, the system processes the request and displays the corresponding results in a structured table format (Figure B). The query results are displayed in a structured table, providing details such as gene names, PubMed ID, species and molecular types. Additionally, the database presents functional descriptions of genes mentioned in the literature, along with experimental verification methods and references to high-throughput sequencing data if available. If users wish to conduct another search, they can easily navigate back to the query interface using the 'Return' button, ensuring a seamless and intuitive browsing experience. For transcriptional regulation information, users can initiate a query by selecting the desired search type from three available options: TF, Gene, or PubMed ID (Figure A). Once the query is submitted, the system processes the request and displays the corresponding results in a structured table format (Figure C). The returned table includes the following information: Transcription Factor (TF), Target Gene, Regulation Type, Species, Stage, Hormone Association, Functional Annotation, Binding Site, Experimental Evidence, PubMed ID, and Data Access. This detailed output allows users to examine the relationships between transcription factors (TFs) and their target genes, explore the regulation type (e.g., activation or repression), and identify the species and developmental stage of the relevant studies. The hormone association provides additional context about potential endocrine interactions, and the functional annotation describes the known biological roles of the TF-target gene pairs. Moreover, the binding site information and experimental evidence help validate the reliability of the interactions, with references to PubMed IDs and available datasets for further exploration. If users wish to conduct another search, they can easily navigate back to the query interface using the 'Return' button.